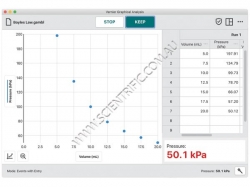
GA4 showing Boyle's Law graph and data view.
Enlarge

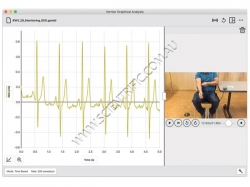
GA-PRO (GAP) showing EKG graph and video clip.
Enlarge

GA4 showing Boyle's Law graph and data view.
Enlarge

GA-PRO (GAP) showing EKG graph and video clip.
Enlarge
Vernier Graphical Analysis
Free downloadVERNIER GRAPHICAL ANALYSIS
Vernier's Graphical Analysis™ is a free software tool for science students to collect, share, graph and analyse data
from Vernier sensors using Chrome™, Windows®, Mac OS™, iOS® and Android™ devices.
Downloads:
• Windows computer running Windows 10 with compatible Bluetooth® radios that support Bluetooth connections View >>>>
• MacOS computer running macOS 10.11 or newer with USB and Bluetooth View >>>>
• Chromebook running ChromeOS 70 or newer with USB and Bluetooth. Available from Chrome Web Store View >>>>
• iOS Devices running iOS 11 or newer. Available from the App Store View >>>>
iPad® (4th generation or newer), iPad mini™, iPad Air® and iPad Pro
iPhone® (5S or newer)
iPod touch® (5th generation or newer)
• Android Devices with Android 6.0.1 or newer. Available from Google Play View >>>>
MSI Silent Installer details and installation instructions View >>>>
The latest version of Vernier Graphical Analysis™ app supports all Vernier Go Direct® sensors now integrating with
Microsoft Excel Data Streamer to bring real-time data into Excel View >>>>
Vernier Graphical Analysis™ Pro
Upgrade to the Pro version by purchasing an annual subscription (see below) that includes all the features of the free Vernier Graphical Analysis app, plus enhanced functions for more advanced analysis. Its illustrative experiment videos and interactive graphing capabilities inspire students to explore crucial scientific concepts and analyze data in new complex and insightful ways.
Vernier Graphical Analysis Pro is compatible with most Vernier sensors and multiple operating systems and devices.
Key Features:
• More than 60 standard Vernier sensors use Vernier Graphical Analysis when connected to LabQuest Mini,
LabQuest Stream or LabQuest 2 depending on your platform’s connection needs.
• Vernier Go Direct™ Sensors use Vernier Graphical Analysis connected by Bluetooth® or USB as needed by your platform.
• Data Sharing: Students can work together in a lab group to collect data using either LabQuest 2 or Logger Pro 3 and
share the data over a network. Each student receives a copy of the data to analyse on their own device.
• Data Collection
Collect data from multiple sensors simultaneously, either with a multiple-channel interface such as LabQuest Stream or
by using multiple Go Direct sensors. Use Data Sharing to retrieve data from just about every Vernier sensor.
Select time-based or event-based data collection, including events with entry.
Adjust data-collection rate and duration as needed.
Trigger time-based data collection on sensor values.
Calibrate sensors, although most of the time this is not needed.
Enter data manually or using the clipboard.
Change display units on many sensors.
• Data Analysis
Display one, two or three graphs as needed.
Set the graph scale.
Select what is graphed on each axis and select line- or point-style graphs.
Calculate descriptive statistics on all or some of your data.
Fit lines and curves to some or all of your data.
Define calculated columns based on sensor columns. Use this to linearise a graph, for example.
View data in a table.
Highlight and read values from a graph.
Interpolate and extrapolate using graphed data.
• Data Storage
Store and retrieve previously shared data collection and analysis sessions.
Save Vernier Graphical Analysis data files with analysis for use in Vernier Logger Pro 3.
Vernier Graphical Analysis End User Licence Agreement (EULA)
Licensing Information:
• Graphical Analysis computer software is free and can be installed on an unlimited amount of computers.
• Graphical Analysis apps for Chrome, iOS and Android are free and distributed through their respective
web stores. Terms and licensing are thus determined entirely by these stores.
Privacy Statement:
COPPA, SOPIPA, and FERPA Compliance. Graphical Analysis complies with USA federal regulations pertaining to student privacy and safety in the following ways:
• Graphical Analysis software does not collect, request, share or store any personal information from students or teachers.
• Graphical Analysis does not display advertisements in the app.
| User Manual | Vernier Graphical Analysis v5.8 | ||
Educational use only:
Vernier and Kidwind products are designed for educational use. They are not appropriate for industrial, medical or commercial applications. Details
Last edited 24th Jan 2023
| Similar Products: | From |
| LP - Vernier Logger Pro 3 Data Logging Software | $719.00 |
| SPECTRAL-ANALYSIS - Vernier Spectral Analysis |
Documents: Catalogue | Vernier Catalogue K-12 | Catalogue | Vernier Catalogue Uni | Catalogue | Scientrific April 2025 Mini Catalogue | Catalogue | Vernier 2025 K-12 Catalogue | Catalogue | Vernier 2025 University Catalogue | Compatibility Guide | Sensor-Interface-Software Requirements (external link) | User Manual | Vernier Graphical Analysis v5.8 | | |||||||||||||||
FAQs: Connection | Do Vernier Apps work with Apple OS and silicon processors? | | |||||
Note: Prices do NOT include GST or freight


 ,
,